Consulting
Parks of Oak Park
Identifying a reliable geofencing solution to measure park usage across Oak Park's parks.
Identifying a reliable geofencing solution to measure park usage across Oak Park's parks.

Completed May 2021 with PDOP, which serves recreational needs for Oak Park's 52,000 residents.

PDOP had no reliable way to measure park usage, relying only on assumptions.

I led my team to a recommended geofencing solution built for accuracy and reliability.

Project Lead

2-4 researchers, rotating

Led client discovery, divided research across the team, and authored the final documentation.
Created in 1912, The Park District of Oak Park (PDOP) serves the recreational needs of the 52,000 residents of Oak Park, providing nearly 3,000 recreation programs and special events annually. Overseen by a Board of five elected officials, the District owns an Administrative Center, two outdoor pools, an indoor year-round ice rink, the Oak Park Conservatory, Cheney Mansion, Pleasant Home, a gymnastics & recreation center, seven recreation centers plus 18 parks totaling 84 acres of parkland. Through the programs and facilities the Park District of Oak Park provides, they significantly contribute to the quality of life in Oak Park.
This data had the potential to help PDOP make better decisions on how to allocate public resources and understand if they were serving their community at an equity level.
By the time we got involved, they had no methods for collecting this data, and their decision-making was based on assumptions.
I led a competitive analysis to identify a solution. Doing this, my team and I built a baseline understanding of what products were available in the space, the key differences between each, and evaluated those against PDOP's use cases: gathering quantitative data, being customizable, integrating with their servers, and having fixed pricing.
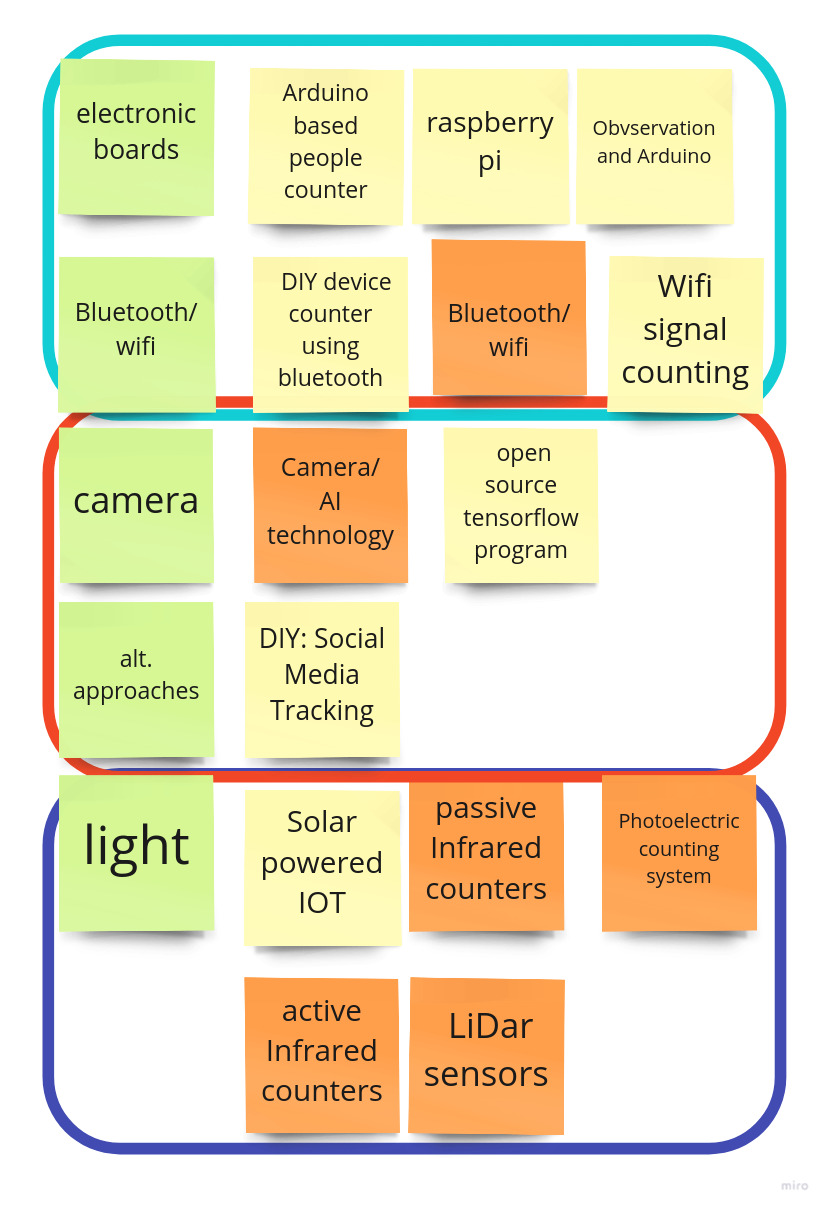
Given the array of people-counting technologies in the marketplace, many of these could be grouped into categories based on either the technology used, like thermal counters, or the approach, like using social media. So we started with a divide-and-conquer style, splitting research across the team (2-4 researchers on a rolling basis) to reduce a huge field of possible options into practical chunks.
To keep our findings organized, I created a Miro board as our shared space for dumping and sorting everything the team found.
We identified clear pricing figures, installation guidelines, data collection details, and each solution's strengths and pain points for each park in the Oak Park district.
Throughout the course of this engagement, I led conversations with PDOP and checked in with our volunteers on progress, identifying gaps I had to fill to support this effort. I also drove out to each park myself to scope the physical space, checking size, layout, and telecommunication infrastructure, to see how practical our proposed solutions could actually be to implement.
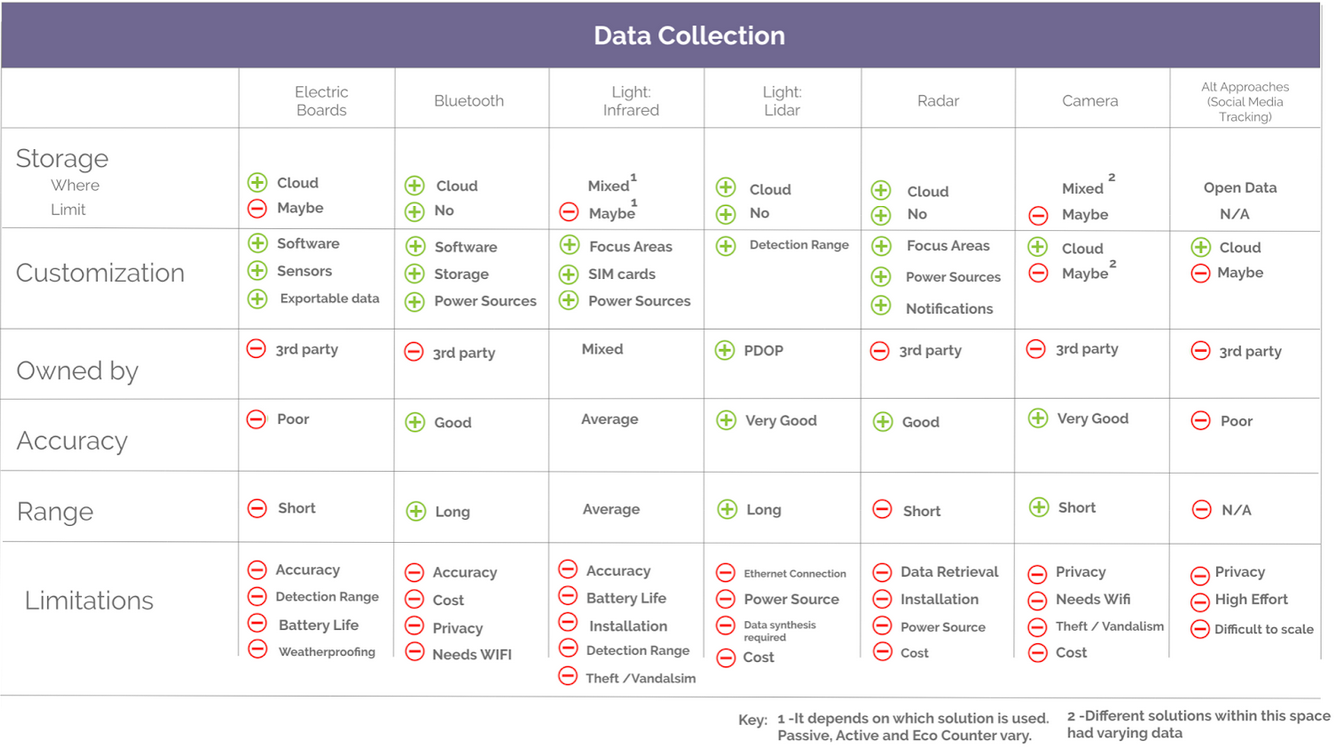
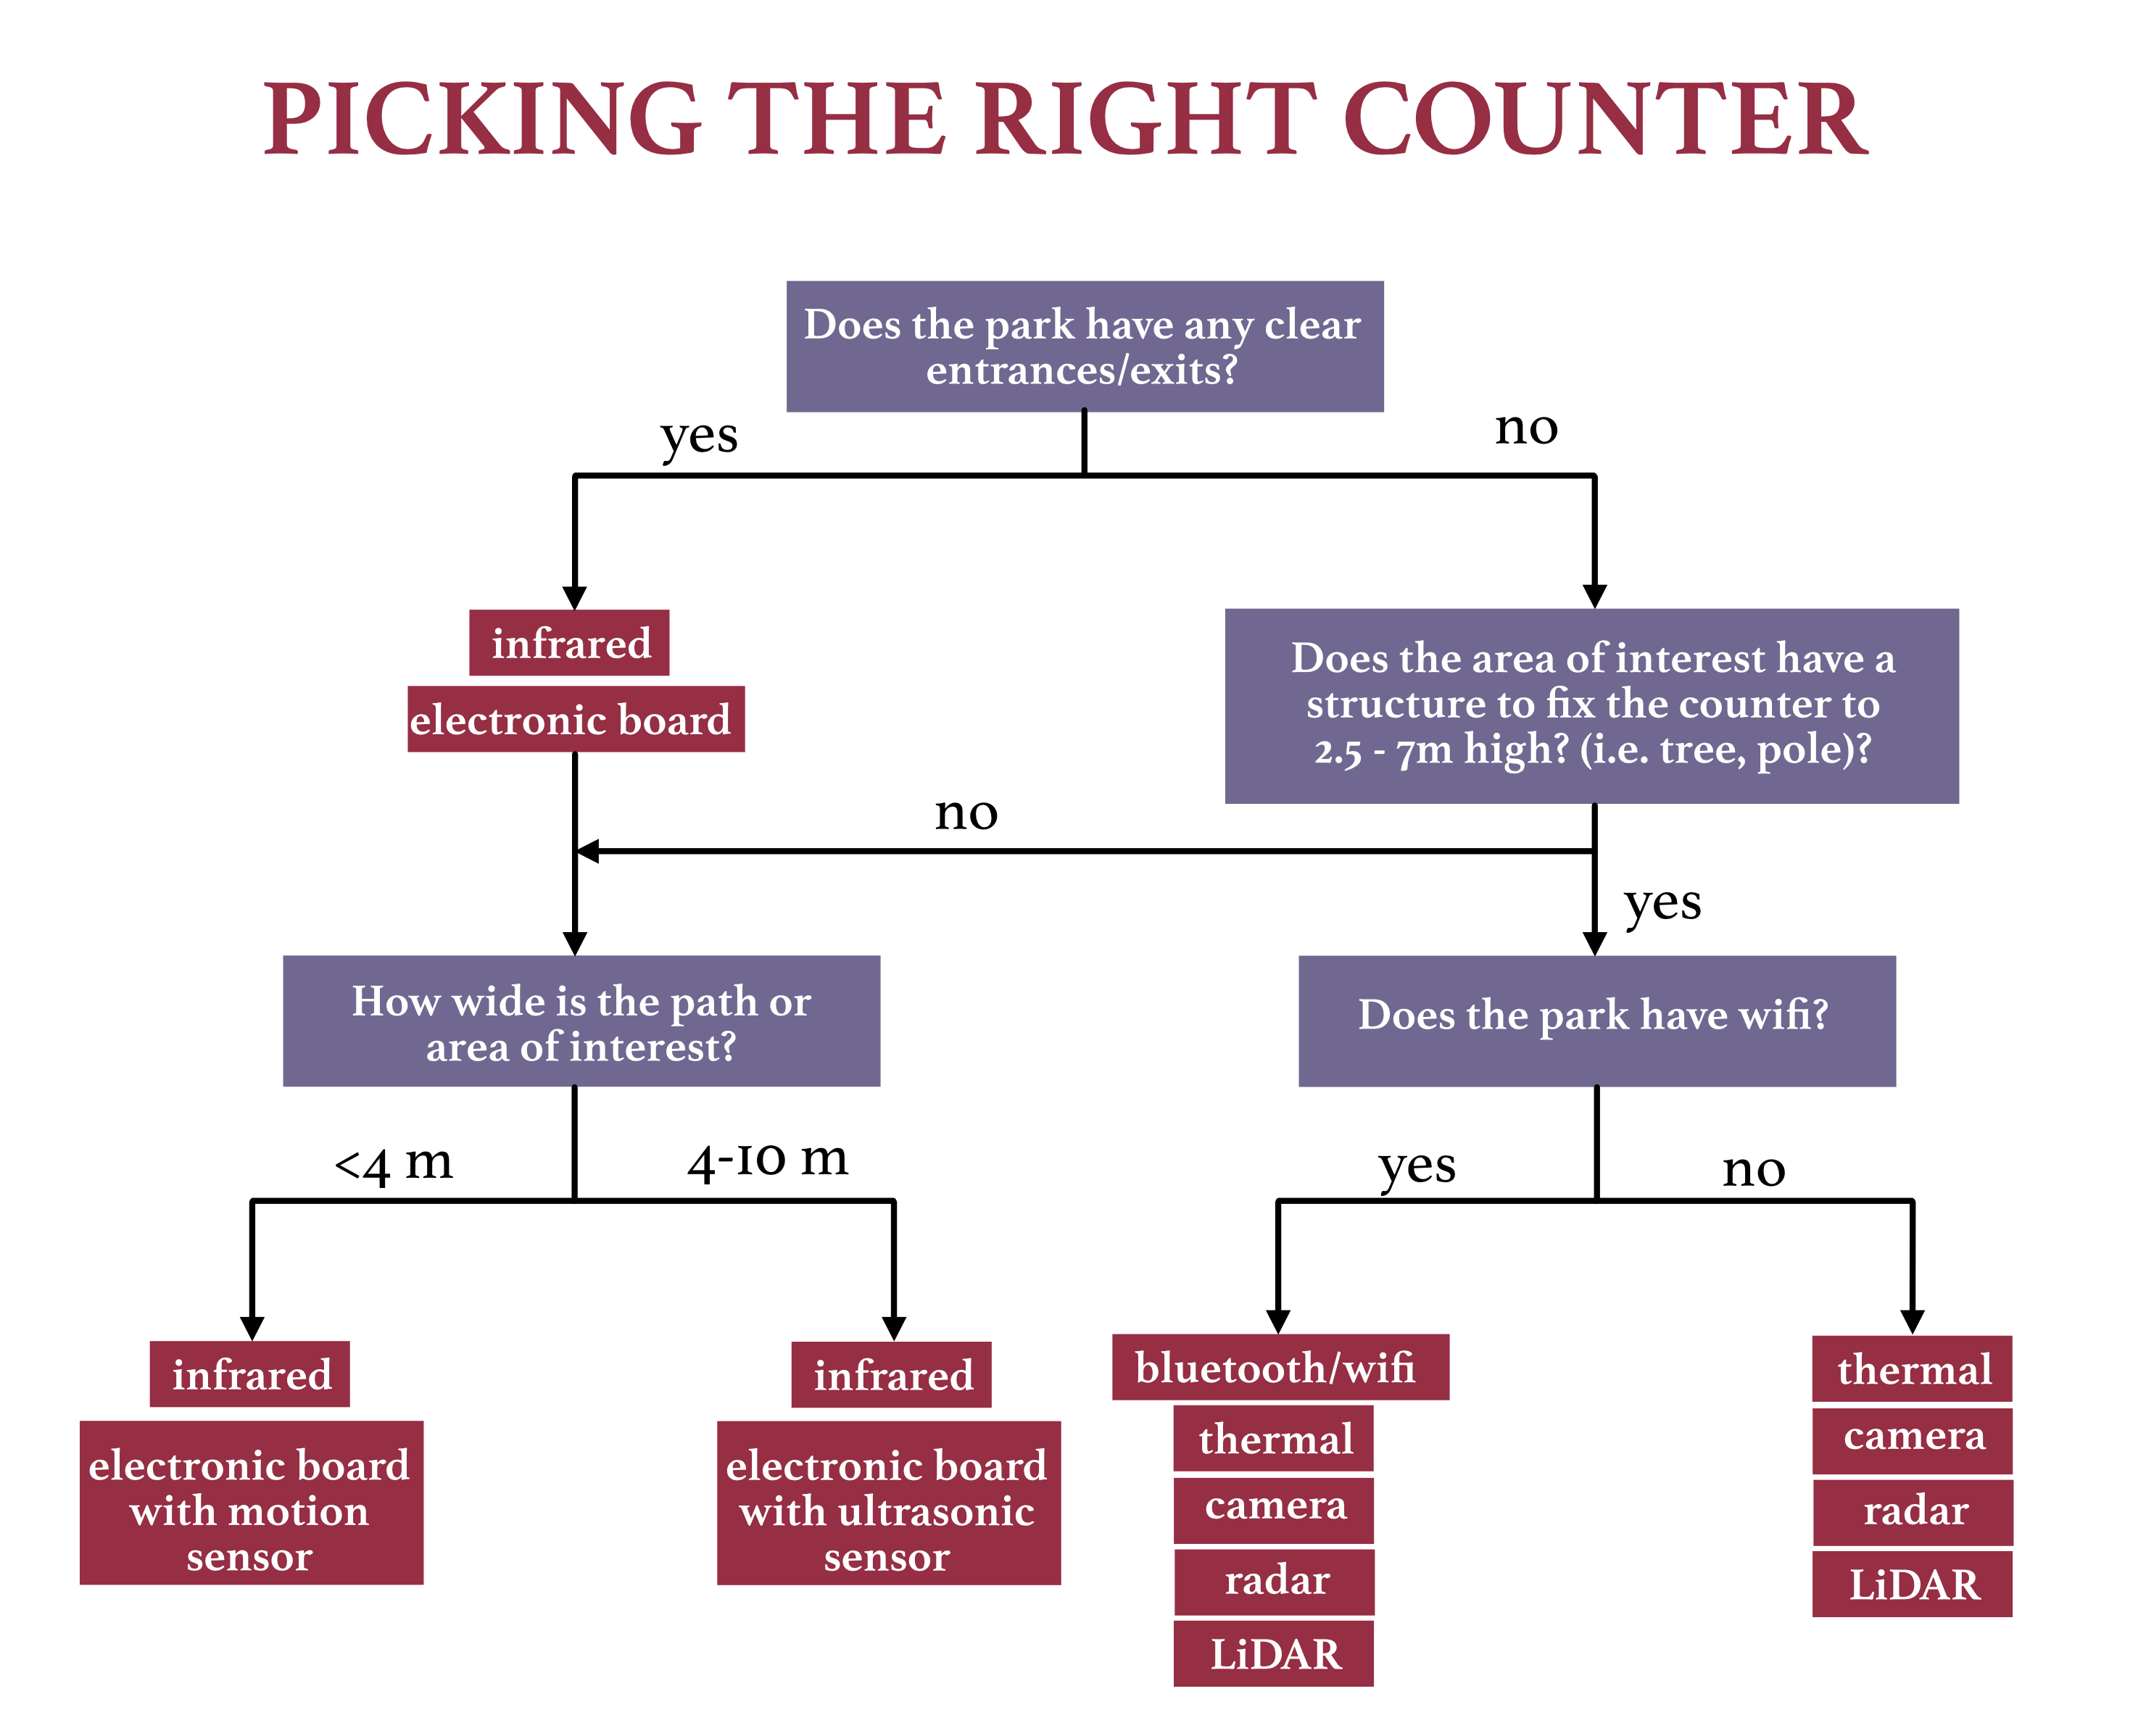
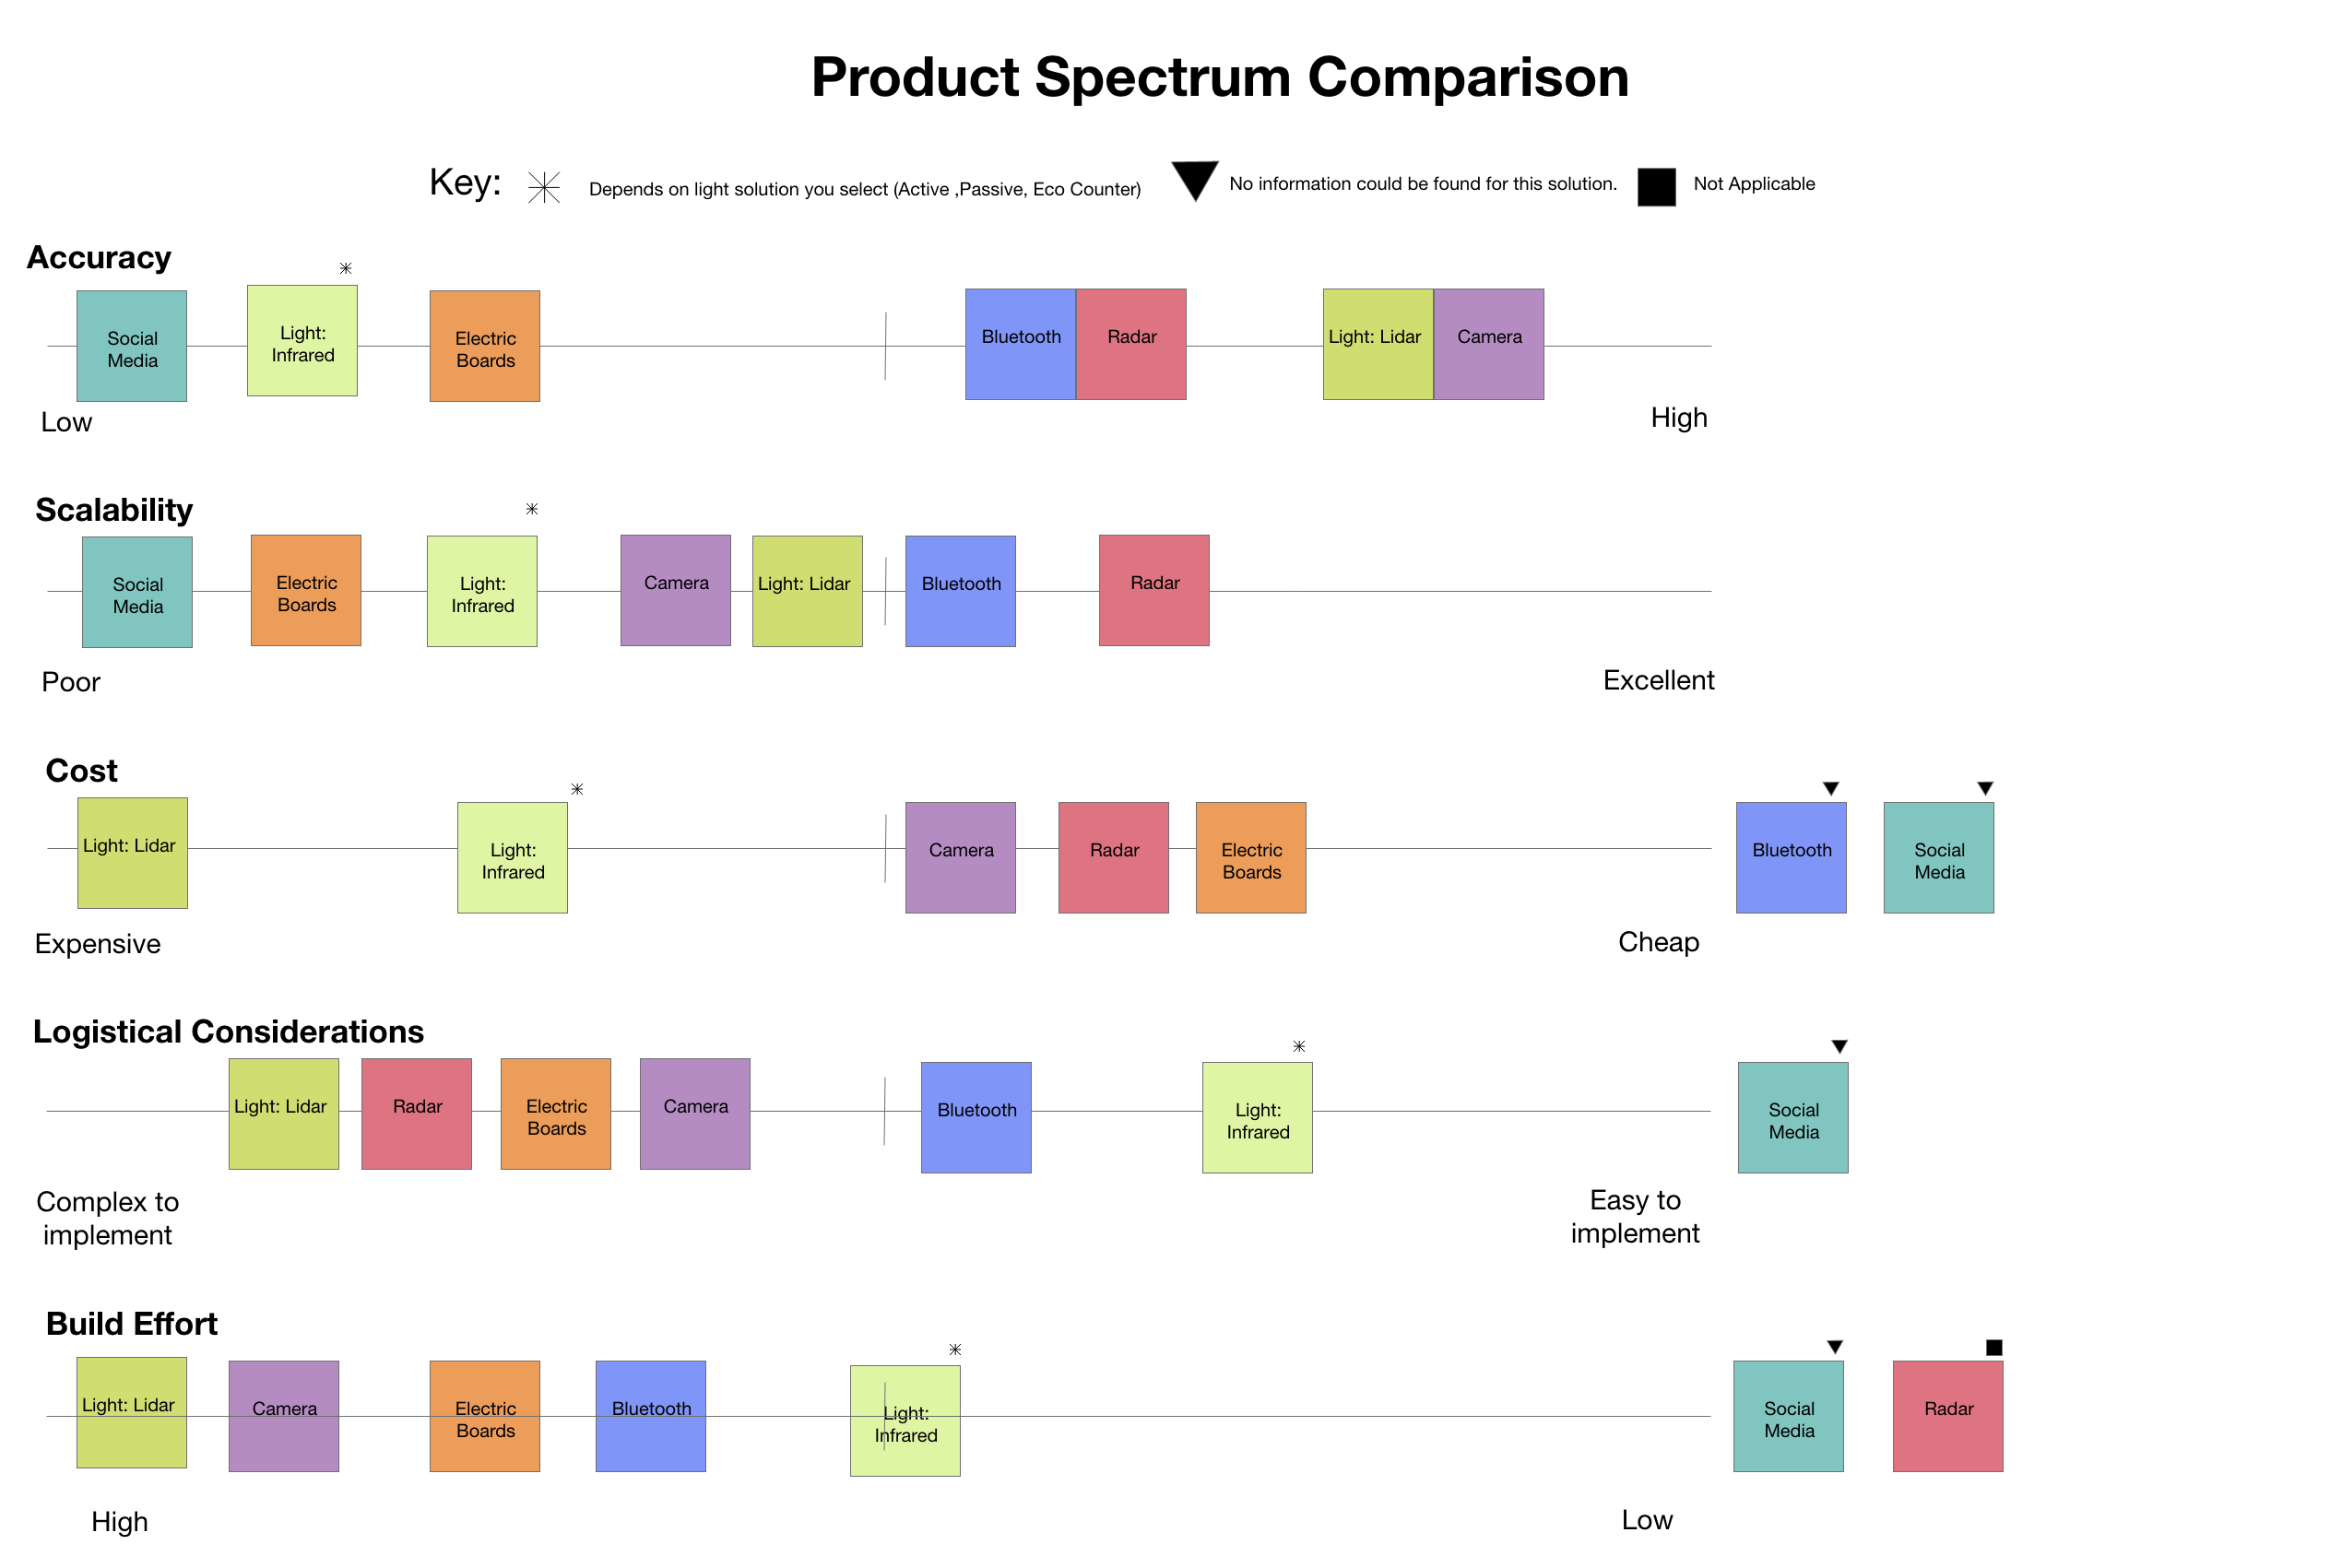
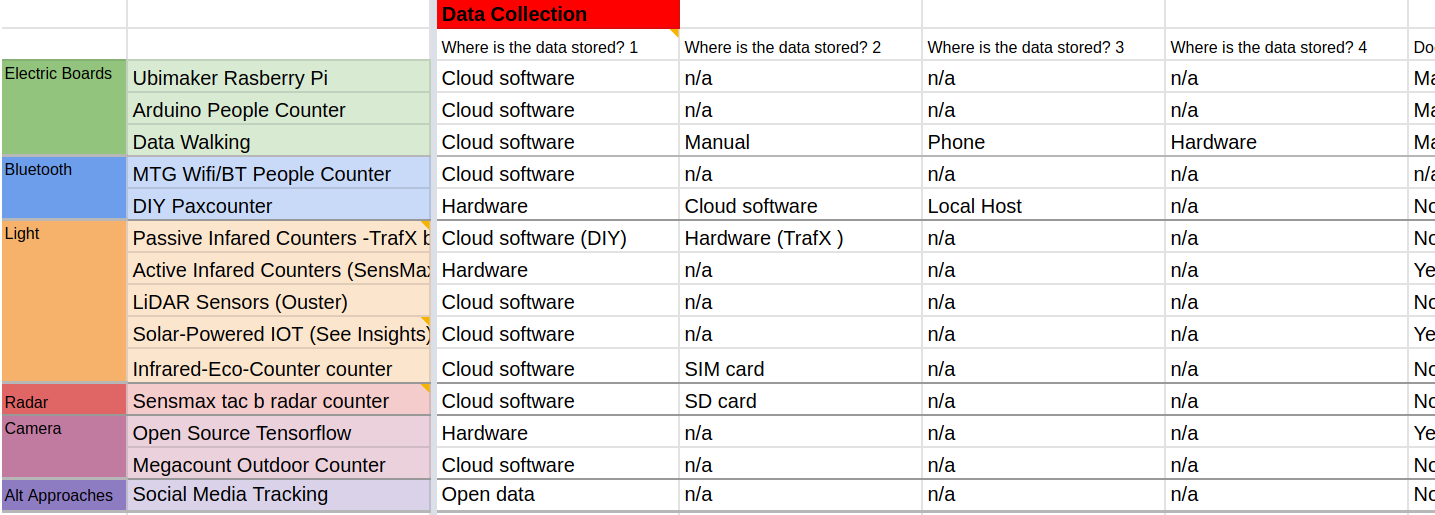
From there, separate from the Miro board, the team built a number of analysis artifacts to evaluate which people-counters would identify the best fit: a decision tree, a detailed table determining power/wifi connectivity, a graph determining trade-offs for each counter, a chart measuring accuracy and cost, and a workflow examination after talking to vendors.
Once all the data was collected, we compared scalability and pricing.
By completing this project, we were able to confidently recommend the ready-made product of a geofencing solution to quantify the number of people that came to the park. This product was recommended because it was: (1) built for the outdoors, (2) listed at a fixed price rate, (3) relatively accurate at 80-90%, (4) not dependent on an internet connection to work, and (5) utilized by other large park and recreation departments.